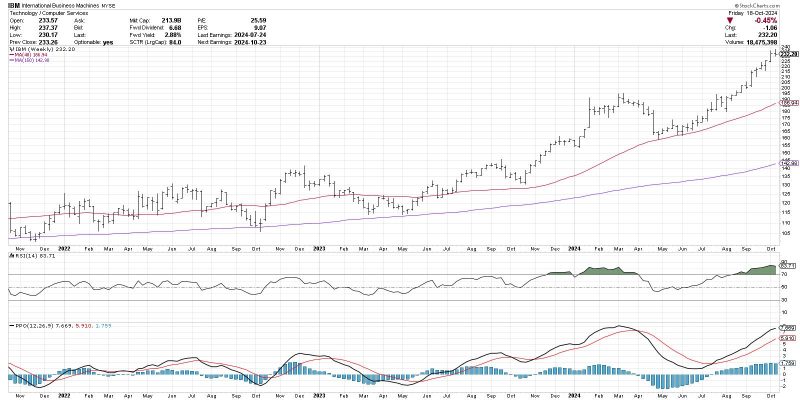
The Moving Average Convergence Divergence (MACD) histogram has long been recognized as a powerful tool in technical analysis. Traders and analysts alike rely on this indicator to identify potential trend changes and make informed decisions in the financial markets. With its ability to visualize the relationship between two moving averages and detect momentum shifts, the MACD histogram offers valuable insights into market dynamics and price movements. In this article, we delve into the complexities of the MACD histogram and explore how it can hold the secret to anticipating trend changes.
Understanding the MACD Histogram
The MACD histogram is a derivative of the MACD indicator, which consists of three components – the MACD line, the signal line, and the histogram. The MACD line is calculated by subtracting a longer-term Exponential Moving Average (EMA) from a shorter-term EMA. The signal line, also an EMA, is then calculated based on the MACD line. The difference between the MACD line and the signal line is represented in the histogram, providing a visual representation of the relationship between the two lines.
Interpreting the MACD Histogram
The MACD histogram oscillates above and below the zero line, with positive values indicating bullish momentum and negative values signaling bearish momentum. Traders often look for crossovers between the MACD line and the signal line as potential buy or sell signals. When the MACD line crosses above the signal line and the histogram moves from negative to positive territory, it suggests a bullish trend may be emerging. Conversely, a cross below the signal line with the histogram moving from positive to negative indicates a potential bearish trend reversal.
Anticipating Trend Changes with the MACD Histogram
One of the key benefits of using the MACD histogram is its ability to anticipate trend changes before they occur. By monitoring the behavior of the histogram relative to the zero line, traders can identify shifts in momentum and potential trend reversals. Divergence between the price action and the MACD histogram can also provide valuable insights, as it may indicate that the current trend is losing momentum and a reversal could be imminent.
Incorporating Other Tools for Confirmation
While the MACD histogram is a powerful tool on its own, traders often combine it with other technical indicators for confirmation. For example, pairing the MACD histogram with trendlines, support and resistance levels, or other momentum oscillators can help validate signals and increase the accuracy of trend predictions. By using a multi-faceted approach to technical analysis, traders can reduce the likelihood of false signals and make more informed trading decisions.
In conclusion, the MACD histogram is a versatile tool that can provide valuable insights into market trends and potential trend changes. By understanding how to interpret and anticipate signals from the histogram, traders can gain a competitive edge in the financial markets. However, it is important to remember that no indicator is foolproof, and risk management should always be a priority when trading. By combining the insights from the MACD histogram with other technical tools and keeping a disciplined approach to trading, investors can enhance their ability to navigate the complex world of trading and achieve success in the markets.
