Navigating the Summer Market Top: A Comprehensive Guide
Understanding market tops during the summer can be a daunting task for investors and traders alike. As the temperature rises, so does the volatility in the financial markets. To successfully navigate a summer market top, it’s essential to have a precise strategy in place. Fortunately, a detailed chart can provide valuable insights and guidance to help investors make informed decisions during this crucial period.
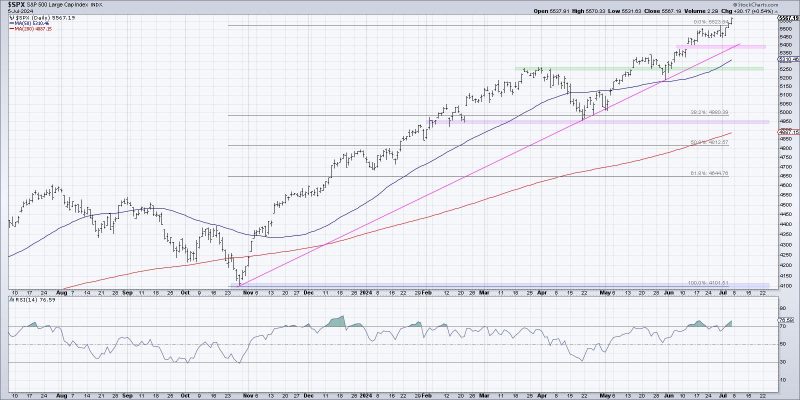
The chart presented in this article incorporates various key indicators and patterns that can help investors identify a potential market top and adjust their investment approach accordingly. Let’s delve into some of the key components of this chart and discuss how they can be utilized effectively.
1. Relative Strength Index (RSI):
The RSI is a momentum oscillator that measures the speed and change of price movements. In the context of a summer market top, the RSI can be a useful tool to gauge whether a particular asset is overbought or oversold. A reading above 70 typically indicates that an asset is overbought, suggesting a potential market top. Conversely, a reading below 30 suggests that an asset may be oversold.
By monitoring the RSI on the chart, investors can identify potential signals of market exhaustion and adjust their trading strategies accordingly.
2. Moving Averages:
Moving averages are commonly used to smooth out price data and identify trends over a specified period. In the context of a summer market top, moving averages can help investors distinguish between short-term fluctuations and long-term trends. The chart incorporates multiple moving averages, such as the 50-day and 200-day moving averages, to provide a comprehensive view of the market dynamics.
Crossovers between different moving averages can signal changes in market sentiment and potential market tops or bottoms. By closely monitoring these crossovers on the chart, investors can make well-informed decisions about their investment positions.
3. Volume Analysis:
Volume analysis plays a crucial role in determining the strength and sustainability of price movements. During a summer market top, observing changes in trading volumes can provide valuable insights into market sentiment. A surge in trading volume accompanied by price highs could indicate that a market top is nearing, as heightened activity often precedes a shift in trend.
The chart presented in this article includes volume bars that help investors track changes in trading volumes and anticipate potential market reversals.
4. Support and Resistance Levels:
Support and resistance levels are critical price levels that indicate areas of buying and selling pressure in the market. By identifying these levels on the chart, investors can anticipate potential price movements and make strategic decisions accordingly. During a summer market top, support levels can act as a safety net, while resistance levels may signal potential barriers to further price appreciation.
Investors can utilize the support and resistance levels depicted on the chart to set stop-loss orders, identify entry and exit points, and manage risk effectively during periods of heightened market volatility.
5. Patterns and Trends:
Patterns and trends are essential components of technical analysis that can help investors forecast potential market movements. The chart presented in this article incorporates various patterns, such as head and shoulders, double tops, and ascending triangles, which can signal important trend reversals or continuations.
By identifying these patterns on the chart and understanding their implications, investors can anticipate potential market tops and bottoms and adjust their trading strategies accordingly.
In conclusion, navigating a summer market top requires a comprehensive understanding of market dynamics and the ability to interpret key indicators effectively. The chart presented in this article serves as a valuable tool to help investors navigate through periods of heightened volatility and make well-informed investment decisions. By incorporating technical analysis, monitoring key indicators, and staying abreast of market trends, investors can successfully navigate a summer market top and optimize their trading performance.
