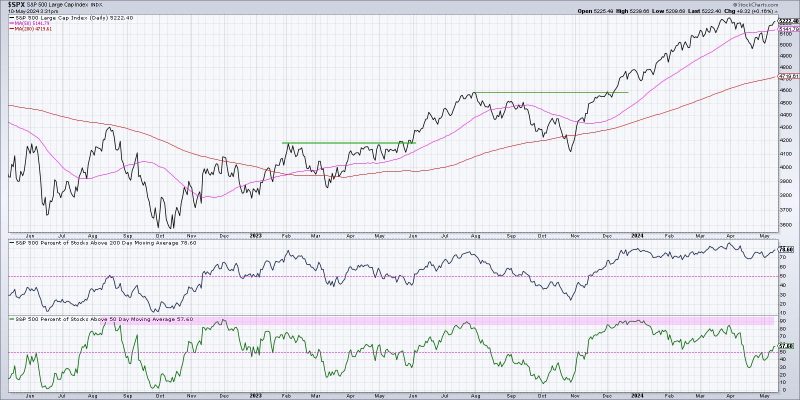
A bullish market trend indicates optimism and positive sentiment among investors regarding the future performance of financial markets. To validate and confirm a bullish market trend, traders and investors often rely on various technical analysis tools and indicators. In this article, we will delve into three key breadth indicators that can help confirm a bullish market trend.
1. **Advance-Decline Line (A/D Line)**
The Advance-Decline Line is a breadth indicator that tracks the number of advancing stocks versus declining stocks over a specific period. By analyzing the overall market breadth, investors can gauge the health of a market trend. In a bullish market, the A/D Line should ideally be trending higher, indicating that a majority of stocks are participating in the uptrend. A steadily rising A/D Line suggests broad-based strength and confirms the sustainability of the bullish trend.
2. **New Highs-New Lows**
The New Highs-New Lows indicator compares the number of stocks hitting new highs versus new lows within a particular period. In a bullish market, an increasing number of stocks recording new highs demonstrates robust market participation and bullish momentum. Conversely, a declining number of new lows signifies diminishing selling pressure and supports the bullish case. Traders often look for a positive divergence between new highs and new lows to confirm a sustainable bullish trend.
3. **McClellan Oscillator**
The McClellan Oscillator is a breadth indicator that measures the momentum of advancing versus declining stocks by calculating the difference between two Exponential Moving Averages (EMAs) of advancing and declining issues. A positive McClellan Oscillator reading indicates that advancing stocks are outperforming declining stocks, supporting a bullish market bias. Traders use the McClellan Oscillator to identify overbought or oversold conditions within the market and to confirm the strength of a prevailing bullish trend.
In conclusion, breadth indicators play a crucial role in verifying the validity of a bullish market trend by analyzing market breadth, new highs-new lows, and momentum characteristics. By incorporating these breadth indicators into their technical analysis toolbox, traders and investors can make more informed decisions and better navigate the complexities of financial markets. As always, it is essential to use multiple indicators in conjunction with other analytical tools to gain a comprehensive understanding of market trends and to mitigate risks associated with investing and trading in dynamic market environments.
