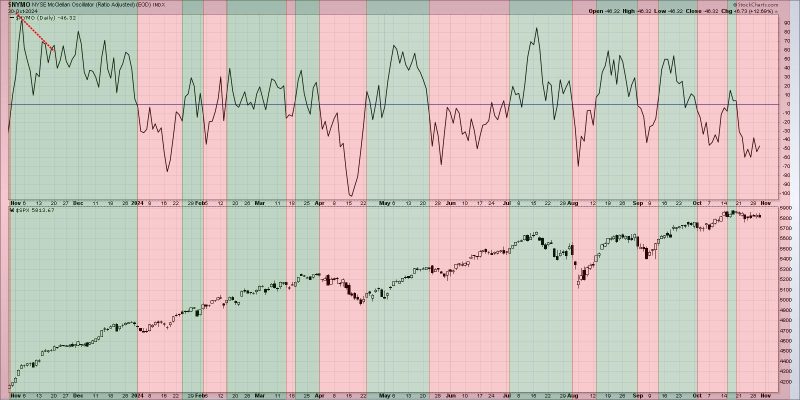
In the world of finance and investing, market analysis tools play a crucial role in helping traders and investors make informed decisions. One such tool that has gained prominence in recent times is breadth divergences. These divergences can serve as valuable indicators of potential shifts in market trends and sentiment, offering insights that can be instrumental in predicting market movements.
What exactly are breadth divergences, and how do they work? Essentially, breadth divergences refer to discrepancies between the performance of a broad index, such as the S&P 500, and the performance of individual stocks within that index. When the overall index is trending upwards, but a significant number of individual stocks are not participating in the rally and instead showing weakness or declining, a breadth divergence is said to occur. This could be an early warning sign that the market’s momentum is weakening, indicating a possible impending correction or reversal.
One of the key benefits of using breadth divergences as a market analysis tool is their ability to provide a more comprehensive view of market health beyond just looking at the performance of a single index. By analyzing the breadth of participation across a wider range of stocks, investors can better assess the underlying strength or weakness of the market trend. A strong market rally with broad participation suggests a healthy and sustainable uptrend, while a rally that lacks breadth and is driven by only a few select stocks may be a sign of vulnerability.
Identifying breadth divergences involves analyzing various breadth indicators, such as the Advance-Decline Line (AD Line), the Advance-Decline Ratio (ADR), or the New Highs-New Lows Index. These indicators track the number of advancing and declining stocks in the market, providing valuable insights into the overall breadth of market participation. By comparing the performance of these indicators with that of the main index, investors can spot potential divergences and gauge the strength of the prevailing trend.
However, it is important to note that breadth divergences, like any other market indicator, are not foolproof and can sometimes produce false signals. Market dynamics are complex and multifaceted, and no single indicator can accurately predict future price movements with certainty. Therefore, it is crucial to use breadth divergences in conjunction with other technical and fundamental analysis tools to validate signals and make well-informed investment decisions.
In conclusion, breadth divergences can be valuable tools for investors seeking to gain a deeper understanding of market trends and sentiment. By monitoring the breadth of market participation and identifying divergences between the performance of broad indices and individual stocks, investors can potentially anticipate shifts in market dynamics and position themselves accordingly. While breadth divergences are not infallible and should be used in conjunction with other analysis methods, they can provide valuable insights that enhance investment decision-making processes.
