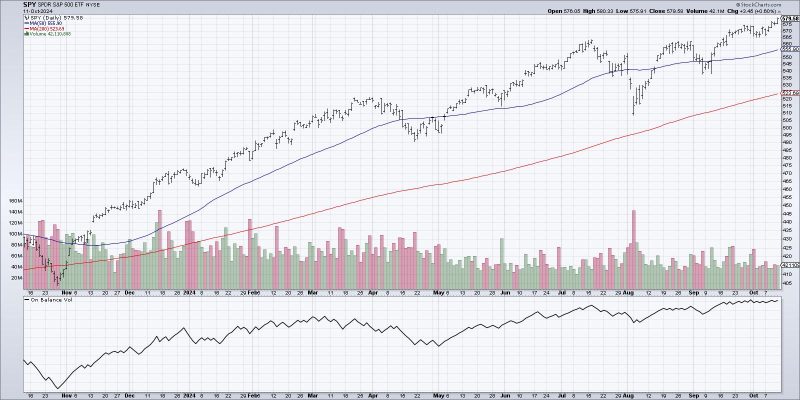
The article from GodzillaNewz explores the importance of a specific volume indicator for traders in the financial markets. By delving into the details of this essential indicator, traders can gain valuable insights into market dynamics and make better-informed decisions.
Understanding Market Volume Indicators
Market volume refers to the total number of shares or contracts traded in a specific security or market during a given period. It is a critical component of technical analysis that helps traders assess the strength and sustainability of price movements. Volume indicators are tools that track and analyze trading volume to provide valuable information about market sentiment and potential trend reversals.
One such important volume indicator is the On-Balance Volume (OBV). Developed by Joseph Granville in the 1960s, OBV is a momentum indicator that uses volume flow to predict changes in stock price. It works on the principle that volume precedes price movement, and therefore, analyzing volume trends can often provide early signals of potential price shifts.
How OBV Works
OBV calculations are based on the premise that during days when the closing price is higher than the previous trading day’s close, the entire volume of that day is considered positive volume. Conversely, on days when the closing price is lower, the entire volume is considered negative. The OBV line is then plotted by adding the current day’s volume to the previous day’s OBV if the price is up, and subtracting it if the price is down.
The OBV indicator is used to confirm price trends. If the OBV is rising along with the price, it suggests that the bullish trend is strong and likely to continue. On the other hand, if the OBV is declining while prices are rising, it may indicate a weakening uptrend and potential trend reversal. Similarly, if the OBV is rising while prices are falling, it could signal a bullish divergence and potential trend reversal to the upside.
Incorporating OBV into Trading Strategies
Traders can use OBV in conjunction with other technical indicators to refine their trading strategies and make more informed decisions. For example, combining OBV with moving averages or trend lines can help confirm trend strength and identify potential entry and exit points. Additionally, divergence between OBV and price movements can provide valuable signals for trend reversals or trend continuation.
It is essential for traders to monitor OBV regularly and incorporate it into their analysis to gain a deeper understanding of market dynamics and improve their trading performance. By paying attention to volume indicators like OBV, traders can enhance their ability to identify trends, predict price movements, and manage risks effectively in the financial markets.
In conclusion, volume indicators such as OBV play a crucial role in technical analysis and can provide valuable insights into market trends and potential reversals. By understanding how to interpret and leverage volume indicators like OBV, traders can enhance their decision-making process and increase their chances of success in the dynamic world of financial trading.
