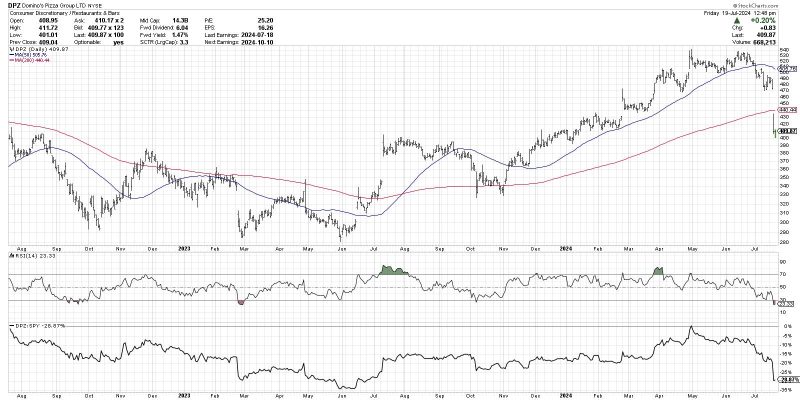
In the world of finance, understanding market trends and patterns is crucial for investors looking to make informed decisions. One key concept that investors often grapple with is identifying a market top – the point at which a security, index, or market reaches its highest value before a downward trend begins. In this article, we will delve into the intricacies of what a market top looks like and how investors can recognize potential signals that may indicate a looming downturn.
Market tops can be characterized by several key indicators that point towards a potential reversal in trend. One of the most common signs of a market top is overvaluation, where prices of securities or indices have risen to levels that are significantly higher than their intrinsic value. This can be driven by factors such as excessive speculation, euphoria among investors, or a disconnect between market performance and underlying economic fundamentals.
Another indicator of a market top is declining trading volumes. As investors become more cautious about the sustainability of high prices, trading activity may start to dwindle, signaling a loss of momentum in the market. Decreased participation from institutional investors or a shift in sentiment towards risk-off assets can contribute to this decrease in trading volumes.
Technical indicators also play a significant role in identifying a market top. Chart patterns such as double tops, head and shoulders formations, or divergences between price and key technical indicators like the RSI (Relative Strength Index) can provide valuable insights into potential trend reversals. These patterns often signal a loss of bullish momentum and may indicate that a market top is imminent.
Moreover, sentiment indicators can offer valuable clues about market sentiment and investor psychology. Extreme levels of bullishness, as measured by sentiment surveys or indicators like the VIX (Volatility Index), can be a warning sign of a market top. When investors are overly optimistic and complacent, it may suggest that a correction or downturn is on the horizon.
Another telltale sign of a market top is the presence of diverging market internals. While the broader market may appear strong, underlying market internals such as the advance-decline line, new highs versus new lows, or sector rotation patterns can reveal weaknesses that are not immediately apparent. Divergences in market internals can indicate that the market is becoming increasingly fragile and susceptible to a downturn.
In conclusion, recognizing a market top is a challenging but essential skill for investors seeking to navigate volatile market conditions. By monitoring key indicators such as overvaluation, declining trading volumes, technical patterns, sentiment indicators, and market internals, investors can better position themselves to anticipate and potentially profit from market downturns. While timing market tops with precision is notoriously difficult, having a solid understanding of the warning signs can help investors make more informed decisions and manage risk effectively in their investment portfolios.
